1. Data Visualization
This module offers tools for creating graphical representations of data, such as charts, graphs, and dashboards, to make complex information more accessible and understandable.
2. Customizable Dashboards
Users can customize dashboards to display key performance indicators, metrics, and data relevant to their roles or specific areas of interest.
3. Real-Time Data
Data and reports are often updated in real time or on a scheduled basis, providing up-to-date insights for decision-making.
4. Interactive Reports
Some modules include interactive features that allow users to interact with data visualizations, explore trends, and drill down into details for deeper analysis.
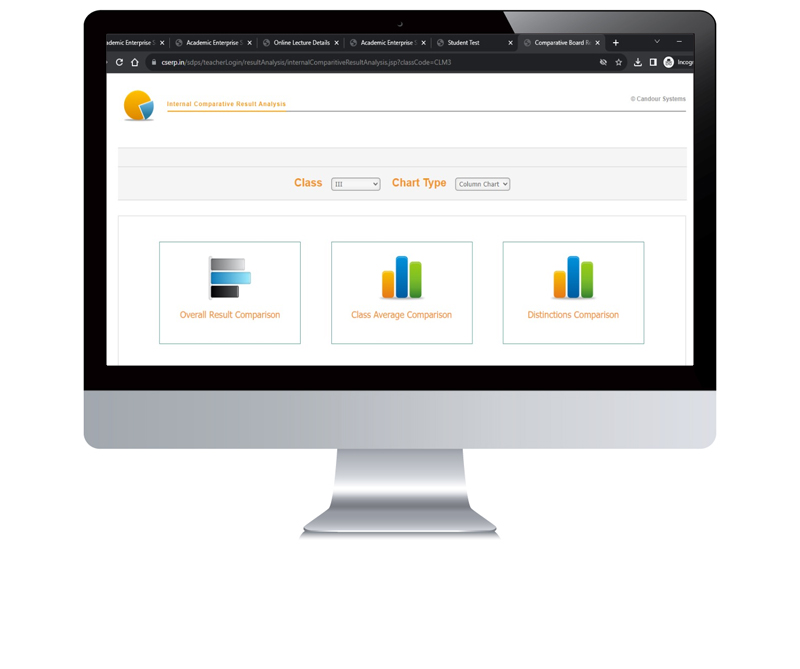
5. Comparative Analysis
Graphical presentations enable users to compare data across time periods, departments, or other variables, facilitating data-driven decision-making.
6. Exportable Visuals
Users can export graphical representations of data in various formats (e.g., PDF, Excel), making it easy to share and present information to stakeholders.
7. Data Storytelling
Visualization tools often include storytelling features that help users convey the significance of data findings and trends in a compelling manner.